Calculate Yield Rate in 3 Steps for Families and Counselors

Yield rate is the percentage of admitted students who actually enroll at a college, calculated as enrolled students divided by total admission offers. It’s the number that tells colleges whether their acceptances are turning into paying students, and it tells you something too: how much leverage a school actually has once it says yes. This guide walks through the formula, the benchmarks, and what colleges do behind the scenes to protect that number.
Table of Contents
What Is the Yield Rate and How Do You Calculate It?
The formula is simple: divide the number of students who enroll by the number of students offered admission, then multiply by 100. That’s it. No hidden variables, no adjustments for demographics or intent scores.
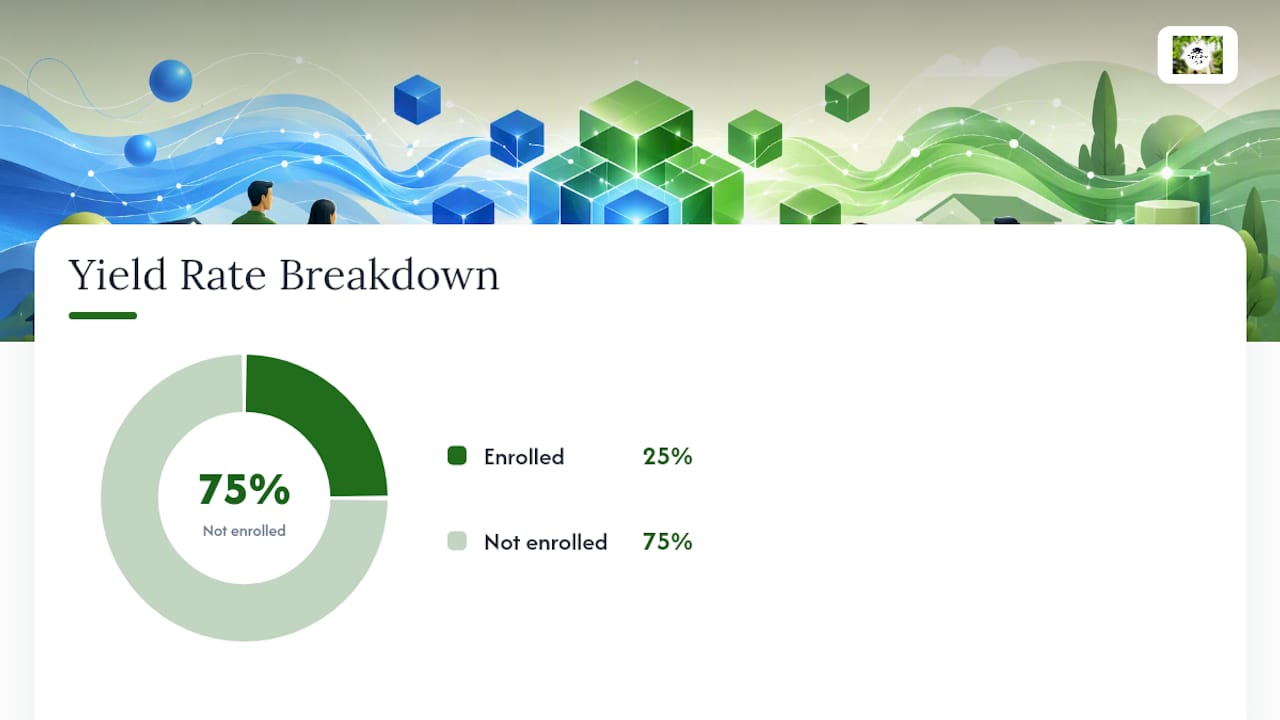
Yield Rate = (Enrolled Students ÷ Admitted Students) × 100
Here’s a worked example. Say a university extends a certain number of admission offers for the fall class and a smaller fraction of those students show up on day one of classes. The math looks like this:
Divide 3,000 (enrolled) by 12,000 (admitted)
The result is 0.25
Multiply by 100 to get 25%
That school has a 25% yield rate), meaning three out of every four admitted students chose to go somewhere else. That’s completely normal for a mid-size public university, and not a red flag at all.
Timing matters here. Most institutions calculate yield annually, tied to the official fall census date, which is when enrollment gets locked in for reporting purposes. But a few wrinkles complicate the clean math:
Deferred admits from an earlier cycle sometimes get folded into the following year’s enrolled count, inflating that year’s yield.
Waitlist admits are almost always excluded from the yield calculation because they weren’t part of the original admitted pool.
Late enrollment decisions, especially transfers who commit after the census date, may or may not count depending on the institution’s reporting policy.
That last point is worth remembering: two colleges can report yield differently depending on how they treat edge cases, so a side-by-side comparison isn’t always apples to apples.
Why Colleges Care So Much About Yield Rate
A high yield signals strong demand, and demand shapes almost every operational decision a college makes for the coming year. Ranking outlets and prospective families both read yield as a proxy for desirability, even though the number is really an admissions-office logistics metric dressed up as a popularity contest.
The practical stakes are bigger than optics. Consider what yield touches:
Class-size planning: admit too many students expecting a low yield, and you get an overcrowded freshman class with no dorm beds left.
Housing allocation: residence life offices build move-in logistics around projected yield weeks before decisions go out.
Financial forecasting: tuition revenue projections, financial aid budgets, and sometimes bond ratings tied to enrollment stability all depend on hitting yield targets.
Faculty staffing: course sections and adjunct hiring get planned around expected enrollment numbers.
Enrollment-management professionals treat yield as an active, ongoing project rather than a number that just happens. According to EAB, protecting enrollment after a student says yes is just as critical as recruiting them in the first place. That single insight explains why admissions offices keep working long after decision letters go out. Learn more about how enrollment management shapes these behind-the-scenes decisions across an entire admissions cycle.
Statistic to remember: enrollment leaders don’t treat the admit decision as the finish line. Post-admit outreach, financial aid confirmation calls, and yield tracking continue for months after acceptance letters go out, precisely because a yes on paper isn’t a yes in the fall census.
What Counts as a High, Average, or Low Yield Rate?
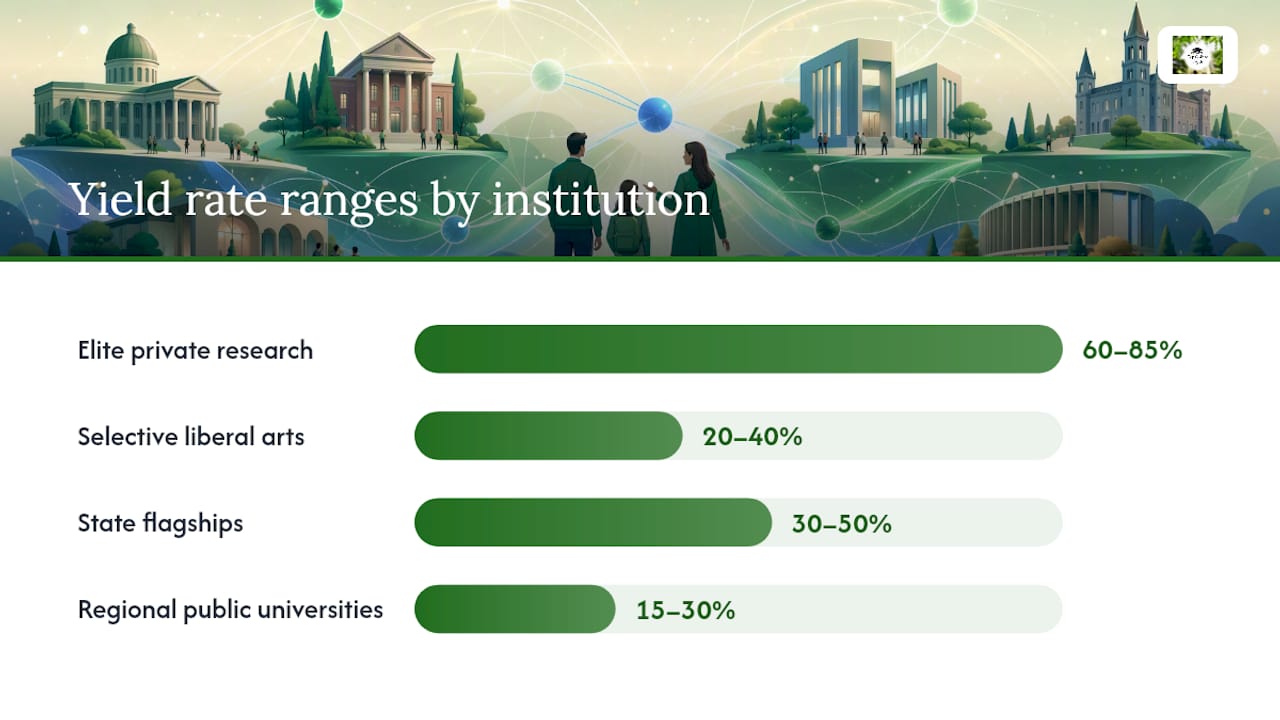
Yield varies enormously by institution type, and a rate that looks alarming for one school may be completely healthy for another. Context is everything here.
Elite private research universities and Ivy League schools: yields often run 60% to 85%, since admitted students rarely have a better offer to compare against.
Selective liberal arts colleges: typically land in the 20% to 40% range, reflecting heavy overlap in applicant pools with peer schools.
State flagship universities: usually fall between 30% and 50%, buoyed by in-state tuition discounts and geographic loyalty.
Regional public universities: often sit lower, in the 15% to 30% band, competing against flagships and community colleges alike for the same students.
Community colleges: yield figures here work differently since many operate with open or near-open admission, making the acceptance-to-enrollment ratio far less meaningful as a selectivity signal.
Institution size and mission drive much of this variation. A small, highly selective college with a narrow, carefully targeted admitted pool tends to post a higher yield than a large public university casting a wide net, because every offer at the small school was calculated to be attractive to that specific applicant. Amherst College’s Common Data Set shows exactly this pattern: a small, highly selective liberal arts college with admits and enrollment figures that translate into a yield well above the national average for its category.
Geography plays a role too. Schools with strong regional draw, like a state’s flagship, often out-yield academically comparable private colleges simply because in-state students already have deep ties to the campus before they apply.
How Colleges Try to Influence Your Enrollment Decision
Admissions offices don’t just wait and hope after decisions go out. They run coordinated campaigns to convert “admitted” into “enrolled,” and most of it is more visible than families realize once you know what to look for.
Admitted-student events: campus days, virtual panels, and overnight stays designed to make the school feel like home before the deposit deadline.
Financial-aid timing: some schools rush award letters to admitted students they want most, giving families an early, favorable number before competitors even respond.
Targeted outreach: personalized emails, phone calls from current students, and faculty introductions aimed at specific admits based on stated interests.
Campus visit tracking: offices log who shows up, who RSVPs, and who opens emails, then route the most engaged admits into higher-touch outreach.
Second-round scholarship offers: additional aid extended in April to admits who haven’t yet committed, sometimes explicitly to close the deal against a rival school.
Demonstrated interest, tracked through visit records, RSVPs, and email engagement, functions as a predictive signal admissions offices use to decide where to spend limited outreach resources. If you’ve ever wondered why a school suddenly started calling after you opened three emails in a row, that’s the mechanism at work. Campus visits in particular carry real weight in how offices read your intent, a dynamic we break down in our piece on whether college visits actually matter for admissions.
This is also where things get ethically murky. “Yield protection,” the practice of rejecting or waitlisting well-qualified applicants a college suspects won’t enroll if admitted, remains one of the more debated tactics in admissions, and schools rarely admit to doing it outright.
Pro Tip: If a school suddenly increases outreach after you visit campus or open a few emails, that’s not a coincidence. It’s demonstrated interest tracking in action, and it means the school is genuinely trying to read your intent, not just performing outreach for its own sake.
What a College’s Yield Rate Should Mean to Your Family
A high yield tells you a school rarely gets turned down, which usually means less room to negotiate financial aid and a more uniform admitted class in terms of academic profile and interests. A low yield can mean the opposite: more aid leverage, but also a campus culture shaped by students who had other options and chose differently for a hundred different reasons.
Neither number should be your deciding factor. Yield measures how other admitted students behaved, not how well the school fits your goals, your major, or your budget.
Use the number as one data point among several:
Verify the figure yourself using the school’s own reporting rather than trusting a secondhand ranking summary.
Ask admissions directly how financial aid timing works, since that often explains yield swings more than prestige does.
If you’re admitted and undecided, don’t assume a low institutional yield means you have unlimited time. Deposit deadlines are fixed regardless of the school’s overall conversion rate.
If you’re waitlisted, understand that waitlist movement is driven entirely by how yield came in below projections. Strong yield years mean fewer waitlist offers, full stop.
Yield Rate vs. Acceptance Rate vs. Financial Yield
These three terms get confused constantly, and mixing them up leads to some genuinely bad conclusions about a school’s selectivity.
Acceptance rate measures how many applicants got in: admitted applicants divided by total applicants. A school with a low acceptance rate is generally considered hard to get into.
Yield rate measures how many admitted students enrolled: enrolled students divided by admitted students. A school with a high yield is hard to say no to once you’re admitted.
Financial yield is an entirely unrelated finance term describing investment income as a percentage of price, covering concepts like current yield and yield to maturity on bonds.
A school can have a low acceptance rate and a low yield at the same time. Plenty of highly selective schools lose admits to even more selective rivals. For a deeper breakdown of how these two admissions figures interact, our guide to acceptance rates walks through real examples. When searching online, add “admissions” or “college” to your query if you want the education definition instead of the bond-market one.
Where to Find a College’s Official Yield Data
The Common Data Set (CDS) and IPEDS are the two standard public sources for verifying a school’s actual admit and enrollment figures, rather than relying on a marketing page’s rounded claim.
Search “[College Name] Common Data Set” plus the most recent year, since most schools post these as public PDFs on their institutional research websites.
Look at Section C1 and C2 of the CDS, which break down first-time, first-year applicants, admits, and enrolled students by category.
Divide the enrolled figure by the admitted figure yourself rather than trusting a third-party summary.
Cross-check against IPEDS if the CDS looks outdated, since IPEDS reporting sometimes lags a full admissions cycle behind.
One caveat: institutions don’t all define “enrolled” identically. Some count students who show up for orientation; others count anyone who paid a deposit and never withdrew. That inconsistency is exactly why comparing two schools’ yield numbers side by side deserves a second look at the underlying CDS notes.
What Admissions Counselors Want You to Know About Yield
Counselors who’ve reviewed thousands of applications read yield differently than a ranking chart does. The number that matters most isn’t the yield itself. It’s what it implies about financial aid flexibility and how uniform the admitted class actually is.
The ethical version of “demonstrating interest” has nothing to do with gaming email open rates. It means visiting campus if you genuinely can, replying to outreach with real questions, and being honest with a school about your intentions instead of stringing along an offer you know you won’t accept. Colleges notice the difference between authentic engagement and performative clicking, and so do the students who end up on waitlists because someone else sat on a spot they never intended to take.
At Top College Coach, we help families read admissions data like this in context, not in isolation, so a single statistic never drives a decision that deserves more nuance.
Why the Yield Obsession Misses the Point
The conventional advice treats yield rate as a shorthand for prestige, and that’s the part I’d push back on hardest. Yield measures conversion, not quality.
Where the standard advice really falls short is in how it treats waitlisted and undecided students. Most guidance stops at “here’s the definition” and never explains that waitlist movement is a direct downstream effect of yield falling short of projections in a given cycle. If you understand that mechanism, you read waitlist news in April completely differently.
My honest read: prioritize verifying the actual CDS numbers yourself before you let any ranking site’s rounded yield figure shape your list. Then spend your energy on fit and financial aid strategy, where the real decision actually happens. Yield is useful context. It’s a weak substitute for judgment.
— Randy Pryor
Sources
FAQ
What Is a Good Yield Rate?
A “good” yield depends entirely on the institution type.
Is Yield the Same as Interest Rate?
No. Yield in college admissions measures the percentage of admitted students who enroll, while interest rate and financial yield are unrelated finance terms describing investment returns, such as yield to maturity on a bond.
How Do I Calculate the Yield Rate?
Divide the number of enrolled students by the number of admitted students, then multiply by 100. Say a university admits 12,000 students and 3,000 enroll, the yield rate is 25%.
Which College Has the Lowest Yield Rate?
Yield varies year to year and isn’t centrally ranked in a single public list, but regional public universities and colleges competing heavily against flagships for the same applicant pool tend to post the lowest yields. Checking a specific school’s Common Data Set is the only reliable way to confirm an exact figure.
If you want help interpreting what a specific school’s yield, financial aid pattern, and admitted-class profile actually mean for your child’s chances, Top College Coach works with families targeting Ivy League and Top 20 schools every admissions cycle. You can start with a free admissions strategy session to walk through your specific list and timeline with a former admissions officer.
Recommended
Comments