PSAT Scores in 2026: What Every Student Should Know

What counts as a good PSAT score in 2026?
A good PSAT score depends on what you’re aiming for, but here’s the honest answer most guides bury: The College Board considers a total score around the readiness benchmark level a useful starting point, scores above this can place students in competitive territory for selective colleges, and the highest score ranges correspond to realistic eligibility for National Merit Semifinalist recognition. The PSAT/NMSQT scores on a scale of 320–1520, so context matters enormously.

Your grade level changes the picture too. A sophomore scoring 1100 is performing well ahead of schedule. A junior at 1100 may need to accelerate SAT prep before application season. Think of “good” as a moving target tied to your trajectory, not a fixed number.
Key PSAT score thresholds at a glance:
Scores below the College Board’s college readiness benchmark indicate a diagnostic starting point
Scores meeting the college readiness benchmark show a solid foundation, with room to grow
Scores above 1200 are competitive for top colleges, showing strong percentile performance
Higher score ranges correspond to National Merit Semifinalist territory, which varies by state
State cutoff ranges for National Merit Semifinalist recognition vary across states
One thing worth remembering: PSAT scores are not sent to colleges and play no direct role in admissions decisions. Their power lies in what they tell you about where you stand, and where to go next.
Table of Contents
How do PSAT score ranges and percentiles put your results in context?
How the National Merit Scholarship Program uses your PSAT score
What your PSAT score tells you about college readiness and scholarship potential
How to read your PSAT score report to find strengths and weaknesses
Other scholarships that use PSAT scores beyond National Merit
Ready to turn your PSAT results into a college admissions strategy?
When do PSAT scores come out, and how do you access them?
Score release timing varies by PSAT version, but students generally see results within six to eight weeks of their test date. For the PSAT/NMSQT, which is typically administered in October, score release dates are posted by College Board and usually fall in December. The PSAT 10 and PSAT 8/9 follow similar windows tied to their respective test dates.
How to access your scores:
Log in to your College Board account at studentscores.collegeboard.org
Open the BigFuture School app, where your total score appears first
Check with your school counselor, who may receive score reports directly
Download the official score report PDF for a full breakdown including section scores, percentiles, and your NMSC Selection Index (PSAT/NMSQT only)
One practical note: score release happens in waves, so if a classmate sees results before you do, that’s normal. Check your College Board account regularly starting about six weeks post-test.
How does PSAT scoring actually work?
The PSAT/NMSQT uses a straightforward two-section structure, but the full score report contains more layers than most students realize. Understanding each layer is what turns a number into a plan.

Score Type | PSAT/NMSQT Range | PSAT 8/9 Range | Notes |
Reading and Writing (section) | 160–760 | 160–760 | One of two section scores |
Math (section) | 160–760 | 160–760 | One of two section scores |
Total Score | 320–1520 | 320–1520 | Sum of both section scores |
NMSC Selection Index | 48–228 | N/A | PSAT/NMSQT only |
The total score is simply the sum of your Reading and Writing score plus your Math score. What makes the PSAT scoring system especially useful is that it shares a common scale with the SAT: a 500 on the PSAT Math section reflects the same achievement level as a 500 on the SAT. That alignment makes your PSAT results a genuine preview of where you’d land on test day.
Key scoring components to know:
Section scores (160–760 each): Reading and Writing, and Math
Subscores (reported on a 1–15 scale): Diagnose specific skill areas within each section
Score range: Each score comes with a band of roughly ±40 points total, acknowledging that a single test score is an estimate, not a precise fixed number
NMSC Selection Index: Calculated as (2 × Reading and Writing score + Math score) ÷ 10; applies to PSAT/NMSQT only
How do PSAT score ranges and percentiles put your results in context?
Percentile ranks are where scores become genuinely meaningful. Your percentile tells you what share of test-takers at your grade level scored at or below your result, based on the past three years of PSAT data worldwide.
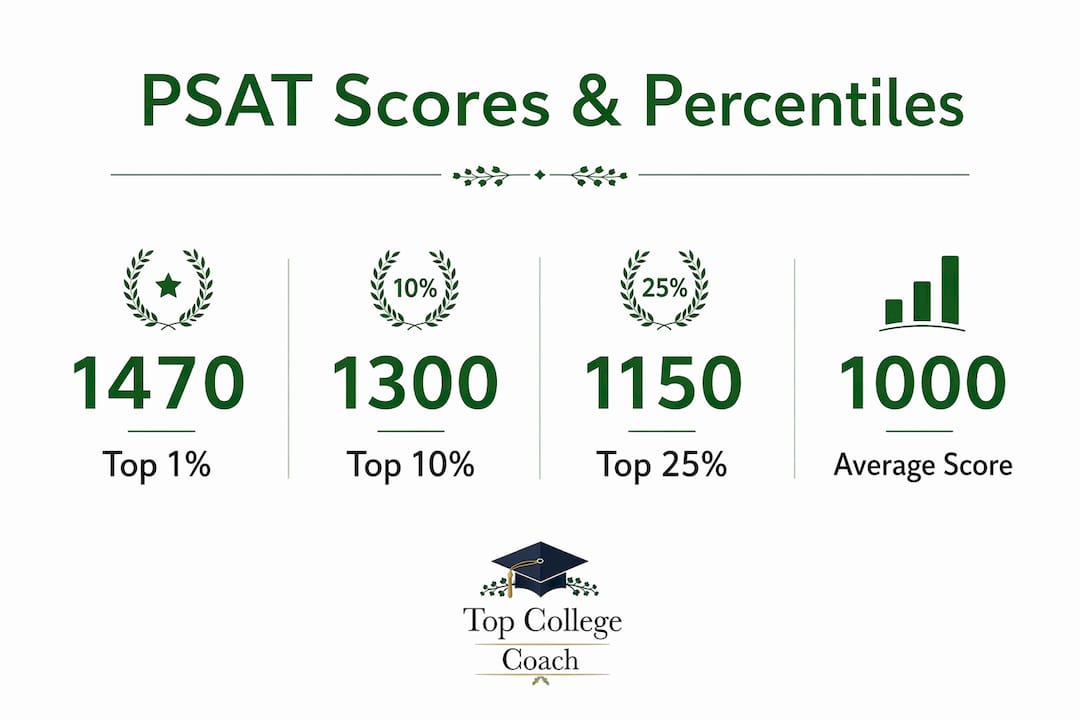
College Board publishes benchmark scores by grade to indicate readiness levels for Reading and Writing and Math, which differ by grade level and help track student progress. Hitting these numbers signals you’re on track for success in first-year college coursework.
Score brackets and what they mean:
Below benchmark: Signals specific skill gaps; use subscores to identify exactly where
At benchmark: On track for college readiness; competitive for many four-year programs
75th percentile and above: Strong performance; positions you well for selective schools
90th percentile and above: Elite range; National Merit recognition becomes a realistic goal
Score spotlight: A Selection Index score in the 210–225 range typically places a junior among the top scorers in their state, which is the threshold for National Merit Semifinalist consideration.
Percentiles are grade-specific, which matters. A junior’s scores are compared to other juniors; a sophomore’s to other sophomores. This is why a sophomore scoring 1150 may rank higher percentile-wise than a junior with the same number.
How the National Merit Scholarship Program uses your PSAT score
Only one version of the PSAT connects to National Merit: the PSAT/NMSQT, taken in junior year. The PSAT 10 and PSAT 8/9 do not generate a Selection Index and cannot qualify students for the program, regardless of how high those scores are.
The NMSC Selection Index is the sole metric National Merit Scholarship Corporation uses for initial screening. The formula: double your Reading and Writing section score, add your Math section score, then divide the total by 10. A student with a 620 Reading and Writing score and a 500 Math score earns a Selection Index of 174, calculated as (2 × 620 + 500) ÷ 10. The Selection Index scale runs from 48 to 228, and state cutoffs for Semifinalist recognition typically fall between 210 and 225.
National Merit facts every junior should know:
Only the junior-year PSAT/NMSQT counts for National Merit eligibility
State cutoffs vary; highly competitive states like New Jersey and Massachusetts tend to have higher thresholds
Approximately 50,000 students receive initial recognition; about 16,000 reach Semifinalist status
Commended Students score below the Semifinalist cutoff but above a national threshold, and may still qualify for certain scholarships
The Selection Index formula weights verbal skills heavily, since Reading and Writing is doubled
One strategic implication: if your Reading and Writing score is significantly lower than your Math score, closing that gap delivers outsized returns on your Selection Index.
What your PSAT score tells you about college readiness and scholarship potential
The PSAT’s most important function isn’t the number itself. It’s the diagnostic picture underneath it. College readiness benchmarks indicate a minimum level for success in first-year college courses, but they are not a ceiling for competitiveness at selective universities. Reaching benchmark is a starting line, not a finish line.
Because the PSAT and SAT share scoring scales, your PSAT results serve as a predictive map for SAT preparation. A student who scores 480 on PSAT Math can reasonably project where they’d land on the SAT that same day, and more importantly, identify exactly which math domains need work before test day arrives.
Pro Tip: Don’t just look at your total score. Pull up your subscores and cross-test scores in the full report. These granular breakdowns show whether your Reading and Writing gap lives in grammar, rhetoric, or reading comprehension, so you can target practice rather than review everything equally.
Using your PSAT results strategically:
Compare section scores to College Board benchmarks to identify which section needs more attention
Use subscores to pinpoint skill-level gaps within each section
Treat your score range (not just the midpoint) as your true performance window
If you’re a sophomore, use results to set a realistic SAT target score for junior year
If you’re a junior, begin structured SAT prep immediately after receiving results
How to read your PSAT score report to find strengths and weaknesses
The score report is more than a number on a page. It’s a structured diagnostic, and most students only read the first line. The full report breaks performance into layers that reveal exactly where time spent studying will pay off most.
Start with your section scores for Reading and Writing and Math. Then move to subscores, which are reported on a 1–15 scale and cover specific skill domains within each section. For Reading and Writing, subscores might cover craft and structure, information and ideas, and expression of ideas. For Math, they cover algebra, advanced math, and problem-solving. A student with a strong total score but a weak subscore in advanced math has a clear, specific target.
Cross-test scores appear across both sections and measure skills like analysis in science and analysis in history/social studies. These scores reflect how well you apply reasoning across different content types, which is increasingly relevant for college-level work.
The score range shown on your report (that band around your score) reflects measurement uncertainty. A single score is an estimate, not a verdict. If your score range overlaps with a benchmark, you’re closer to that threshold than the midpoint alone suggests.
Other scholarships that use PSAT scores beyond National Merit
National Merit gets most of the attention, but it isn’t the only scholarship program that looks at PSAT performance. Several organizations use PSAT results as an entry point or eligibility screen for their own awards.
The National Hispanic Recognition Program and the National Achievement Scholarship Program (for African American students) both use PSAT/NMSQT scores as part of their selection process. Students who meet score thresholds for these programs may receive recognition and scholarship opportunities independent of National Merit standing.
Some state-level scholarship programs and private foundations also reference PSAT performance as an indicator of academic promise, particularly for students in early high school. It’s worth checking with your school counselor about regional programs that factor in standardized test scores at the PSAT level. Strong AP exam performance alongside a competitive PSAT score can strengthen your profile for merit-based awards that consider overall academic rigor.
Practical ways to improve your score before the next test
The PSAT is not a one-shot event. Sophomores who take it have a full year before the junior-year PSAT/NMSQT that actually matters for National Merit. That window is an advantage, but only if you use it deliberately.
Targeted strategies that move the needle:
Review your subscores first. Identify the one or two skill areas with the lowest scores and focus there before reviewing everything broadly.
Use Khan Academy’s free SAT prep. Because the PSAT and SAT share a scale, all SAT prep on Khan Academy directly applies to PSAT readiness.
Take timed practice sections. Pacing is a separate skill from content knowledge. Many students lose points not because they don’t know the material, but because they run out of time.
Read widely and analytically. The Reading and Writing section rewards students who can quickly identify an author’s purpose and evaluate evidence. Regular reading of long-form articles builds this naturally.
Revisit your score range, not just your score. If your range overlaps with a benchmark or cutoff, a modest improvement in one section may push you clearly above it.
Consistent, focused preparation over several months outperforms a cramming sprint every time. The role of standardized testing in college admissions rewards students who treat these assessments as skills to develop, not obstacles to survive.
What the full score report includes, section by section
When your results arrive, the score report PDF and BigFuture School app both display your results, but the PDF is more complete. Here’s what you’ll find and what each element means.
Total score (320–1520): The headline number, combining Reading and Writing and Math. Useful for a quick benchmark comparison, but not the whole story.
Section scores (160–760 each): Reading and Writing and Math reported separately. These are the scores used in the NMSC Selection Index calculation.
Score range: A band around each score reflecting the natural variability of test performance. Think of it as a confidence interval, not a flaw in the system.
Percentile ranks: Compared against all students in your grade who took the same PSAT version in the past three years. These tell you where you stand nationally, not just how many questions you got right.
Subscores (1–15): The most underutilized data in the report. These granular scores identify specific skill gaps within each section and are the clearest guide to where focused practice will have the greatest impact.
Cross-test scores: Measure analytical reasoning applied across science and history/social studies contexts, reflecting skills colleges increasingly value.
NMSC Selection Index (PSAT/NMSQT only, 48–228): Calculated automatically and displayed on the report. This is the number that determines National Merit eligibility, not your total score.
Ready to turn your PSAT results into a college admissions strategy?

A strong PSAT score is a signal, but knowing how to act on it is what separates students who reach their goals from those who leave opportunity on the table. At Top College Coach, we’ve helped students from across the country translate early test results into admission offers at Ivy League and Top 20 universities. Our counselors know exactly how to read a score report, identify the right preparation path, and build a college application strategy that reflects your full potential.
Whether you’re a sophomore seeing your first scores or a junior preparing for the National Merit process, a free admissions strategy session with Top College Coach gives you a clear, personalized roadmap for what comes next.
Key Takeaways
The PSAT is your earliest, most detailed preview of SAT readiness, and students who read the full report, not just the total score, gain a measurable preparation advantage.
Point | Details |
Score scale and structure | The PSAT/NMSQT scores on a 320–1520 scale, with two section scores of 160–760 each. |
College readiness benchmarks | 970+ total meets the College Board benchmark; 1200+ is competitive for top colleges. |
National Merit threshold | The Selection Index (48–228) drives National Merit eligibility; state cutoffs typically range from about 210 to 225 depending on state. |
Scores are ranges, not absolutes | Each score carries a band of roughly ±40 points, reflecting normal test-to-test variability. |
Subscores are the most useful data | The 1–15 subscores pinpoint specific skill gaps and should guide your SAT preparation plan. |
Recommended
Comments